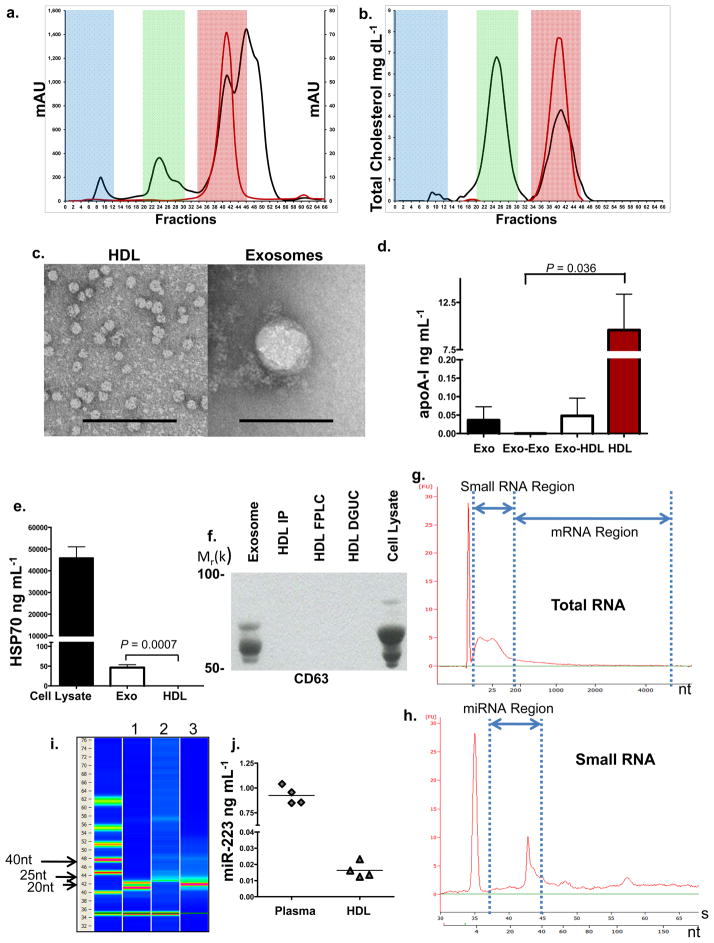
Figure 1. HDL RNA Analysis.
a.) Human plasma and HDL FPLC protein distribution (mAU). Red shading, HDL; green shading, LDL; and blue shading, VLDL-exosome. Black line, human plasma; red line, purified HDL. b.) Human plasma and HDL FPLC total cholesterol distribution (mg dL−1). Black line, plasma; red line, purified HDL. c.) TEM of HDL and exosomes, Scale bar = 100 nm. d.) Quantification of ApoA-I (ng mL−1) protein. Exo, exosomes (n=3); Exo-Exo, FPLC exosome zone from total exosome preparations (n=3); Exo-HDL, FPLC HDL zone from total exosome preparations (n=4); HDL, purified from plasma (n=5). Data are means +/− s.e.m. e.) Quantification of HSP70 protein (ng mL−1), Huh7 cell lysates (n=4); Exo, exosomes (n=4); and HDL, purified from plasma (n=4). Data are means +/− s.e.m. f.) Western blot, Anti-CD63. Purified exosomes; HDL IP, HDL immunoprecipitation; HDL FPLC; HDL DGUC, HDL density-gradient ultracentrifugation; Huh7 cell lysate. Uncropped image of blot (Fig. S6) g.) Bioanalyzer Pico analysis of HDL total RNA. h.) Bioanalyzer Small RNA analysis of HDL total RNA. i.) Digital gel electrophoresis of HDL small RNAs. Lane 1, miRNA standards 22 & 25 nts; Lane 2, HDL total RNA; Lane 3, miR-223 positive control. j.) Quantification of hsa-miR-223 levels (ng mL−1). n=4.

