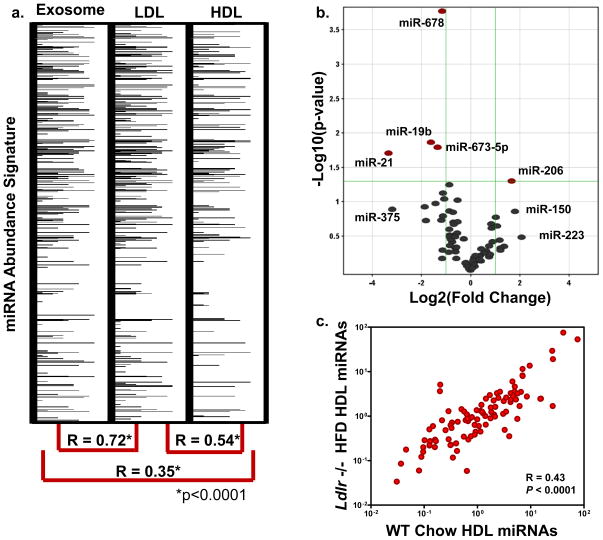
Figure 3. The role of LDL and the LDL receptor in HDL-miRNA signatures.
a.) miRNA abundance signatures of human exosomes, LDL, and HDL from same subject. Spearman non-parametric correlation between each profile. *p<0.0001. miRNAs are numerically ranked top-down and abundances are represented by horizontal band intensity. b.) Volcano plot of significant (P<0.05) differential (>2.0-fold) HDL-miRNA abundances in Ldlr −/− HFD mice (n=3) compared to WT controls (n=3). Red marks, >2-fold change (Log2); P<0.05 (−Log10). c.) Spearman non-parametric correlation between Ldlr −/− HFD mice and WT controls. R=0.43, P<0.0001.

