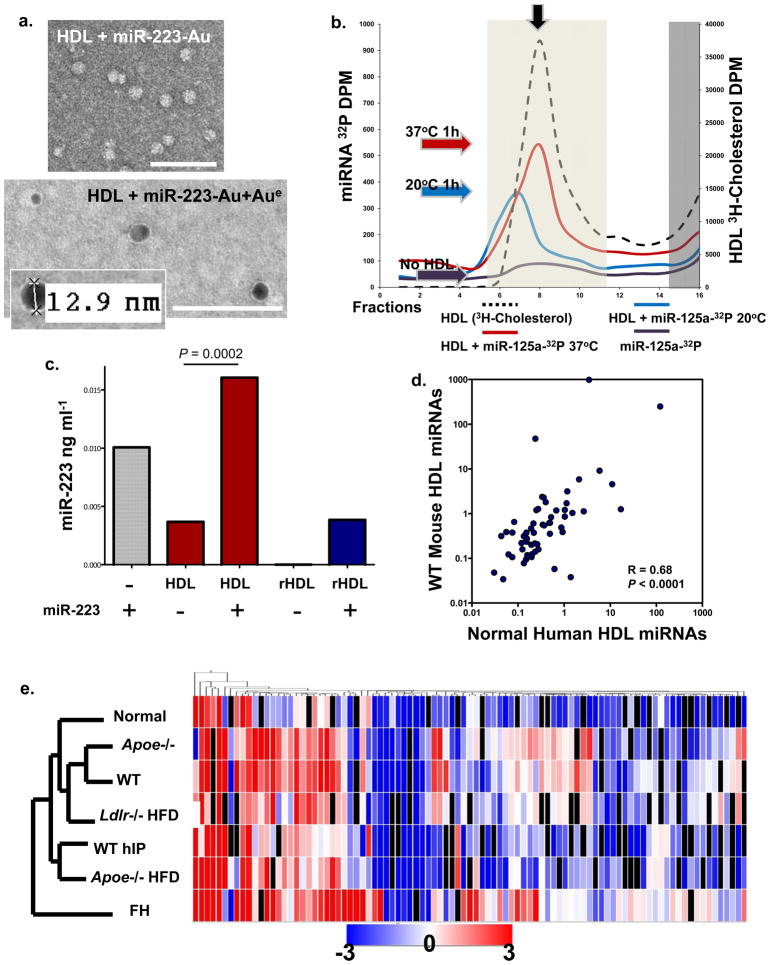
Figure 4. HDL readily incorporates with miRNAs in vitro and in vivo.
a) TEM image of HDL + Nanogold-labeled miRNA (miR-223-Au) unenhanced (Top); HDL + Nanogold-labeled miRNA (miR-223-Au) gold enhanced (Aue) (2 min) (Bottom). Scale bars = 100 nm. b.) FPLC separation of radiolabeled HDL (3H-cholesterol) -miRNA (32P-miR-125a) complexes. Red line, HDL + 32P-miR-125a (37°C reaction); blue line, HDL + 32P-miR-125a (20°C reaction); purple line, 32P-miR-125a alone; black dash line, 3H-HDL + cold miR-125a. Light shading indicates HDL complex zone, dark shading indicates uncomplexed free radiolabeled 32P-miR-125a and 3H-HDL zone. Colored arrows indicate peak associations, red (37°C), blue (20°C), purple (no HDL). S200 Column. c.) Quantification of HDL-miR-223 incorporation. hsa-miR-223 (ng ml−1) levels post-HDL-IP, miR-223, positive control; native human HDL; native human HDL + miR-223; reconstituted HDL (rHDL); rHDL + miR-223. n=2 d.) Spearman non-parametric correlation between WT mouse and normal human HDL profiles. R=0.68, P<0.0001. e.) Hierarchal clustering heatmap of HDL-miRNA profiles (mean) in wellness, hyperlipidemia, and atherosclerosis (mouse & human). n=7 conditions: FH, familial hypercholesterolemia (n=5); Apoe−/− HFD (n=4); WT hIP (n=3), rHDL retrieved from wild-type (WT) mice (n=3); Ldlr −/− HFD (n=3); WT chow diet (n=3); Apoe−/− chow diet (n=3); and Normal human HDL (n=6).

