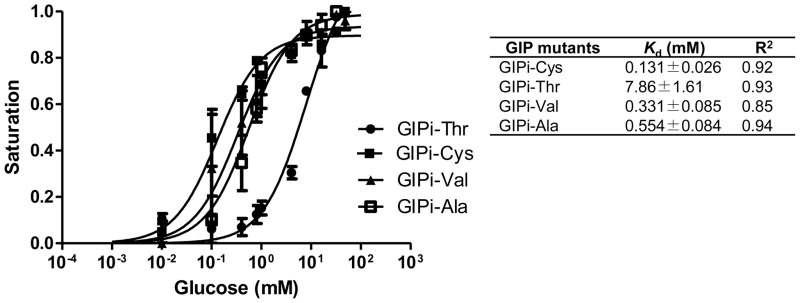
Fig. 1.
Nonlinear regression of glucose binding isotherm curves of mutated GIPs. Data shown are the mean of three experiments and error bars stand for standard deviations of the mean. Symbol: Kd, dissociation constant of GIP; R2, the square of correlation coefficient. The calculation of Kd value was performed using steady-state intensity data fitting to one-site saturation binding isotherm with nonlinear regression, as described elsewhere (Garrett et al. 2008).

