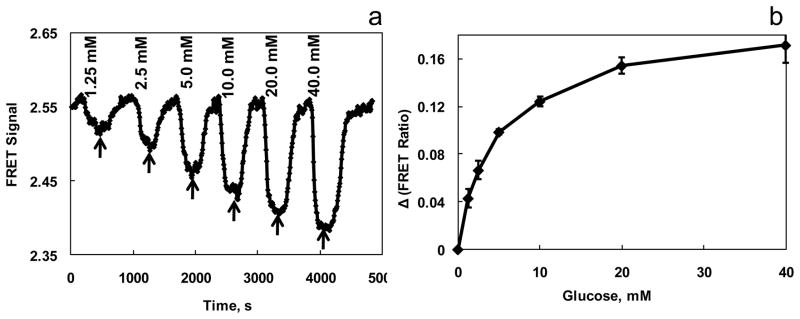
Fig. 2. Continuous glucose monitoring through ratiometric FRET measurement with the GIPi-Thr sensor.
(a) Buffers containing various glucose concentrations from 1.25 mM to 40 mM were flown through the sensor assembly and the FRET signals were recorded continuously every 6 s. the sensor was excited at 435 nm. Its emission at 475 and 525 nm were monitored with a luminescence spectrophotometer. The slit widths were set at 10 nm for both excitation and emission. The arrows indicate the flow of sugar-free bath into the sensor assembly. (b) CGM experiments were repeated (n=3) and its glucose response curve was determined. The Δratio reflects the differences between the peak height at a given glucose concentration and the baseline in CGM curve. The measurements were performed at room temperature.

