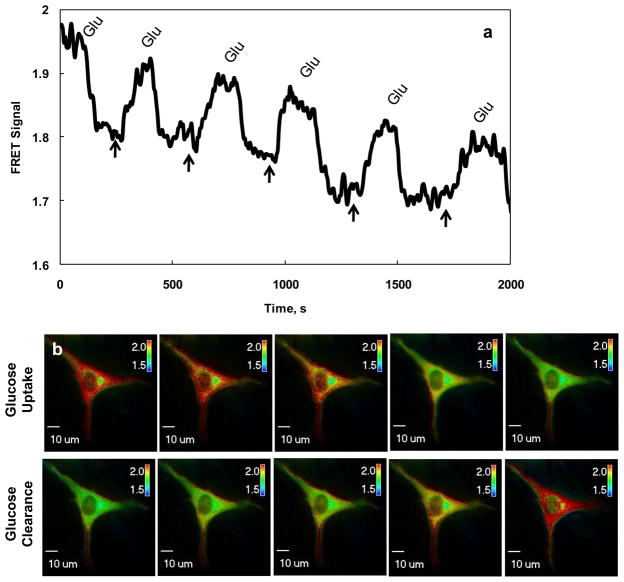
Fig. 3. Visualization of intracellular glucose in single live cell with GIPi-Cys.
(a) The measurement of FRET signals in response to changes in intracellular glucose in single live cells and (b) pseudo-colored ratiometric FRET images of cells cultured in different glucose concentrations. The murine myoblast cells (C2C12) were cultured in a medium perfusion chamber and were transiently transfected with pGIPs-Cys encoding the GIPi-Cys indicator. The ratiometric FRET images were taken 36 h post transfection. To determine the response of GIPi-Cys to changes in intracellular glucose concentrations, 10mM glucose or N-methyl-d-glucamine containing media were perfused into the chamber. The FRET images showing changes in intracellular glucose concentrations, caused by changes in extracellular glucose concentrations, were taken using an Olympus inverted FRET microscope IX 71. The response curve shown in (a) was determined from the images taken in (b) using a FRET imaging microscopy measurement software (Slidebook). LUT in (b) represents the FRET signals.

