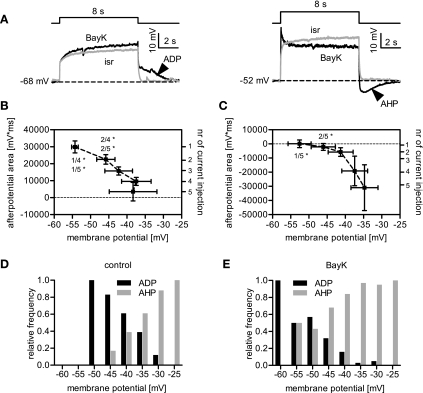
Fig. 3.
Dependency of afterpotentials on the stimulus amplitude. A: when neurons were depolarized for 8 s using five incremental current injections (in the presence of 500 nM TTX), ADPs followed the current pulses at milder depolarizations, whereas AHPs were elicited by strong stimulation. This is illustrated by sample traces recorded in the presence of either BayK (black traces) or isradipine (isr, grey traces), for a smaller (left) and a larger current-induced depolarization (right). Arrowheads highlight the afterpotentials. B and C: depolarizations induced by each incremental current step were grouped according to the pulse number (see y-axis on the right), and the x-axis values are depicted as means membrane voltage ± SE obtained in isradipine. The y-axis values (left axis) represent the afterpotential measured as area (mV·ms) ± SE in the respective depolarization group. B: data obtained from 7 cells displaying an ADP, showing that ADPs decrease in the course of growing depolarizations. C: data obtained from 7 cells developing an AHP with increasing depolarization. Statistical analysis in B and C was performed using Kruskal-Wallis one-way ANOVA, and pairs of data were compared using Dunns post hoc test (the numbers in the graph indicate the pairs that were tested against each other; *P < 0.05). D and E: relative-frequency distribution of afterpotentials plotted against the level of depolarization (evaluated in the presence of isradipine) for events occurring under control conditions (D) and BayK-induced events (E).

