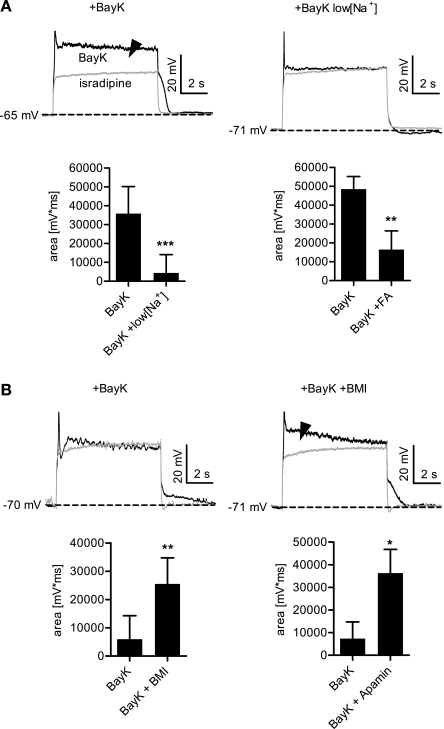
Fig. 4.
Ion conductances responsible for de- and hyperpolarizing LTCC-mediated effects on membrane voltage. A: bumps are attenuated upon reduction of external Na+. The area between the response recorded in isradipine and the one recorded in BayK was evaluated in cells with a clearly discernible bump. An example is shown in the left traces, the arrowhead indicates the measured area. Thereafter, the recordings were repeated in low [Na+] solution as shown by right traces. The left bar graph summarizes the results of identical experiments on 12 cells. Application of low [Na+] solution largely reduced the bumps (by 88% on average). A qualitatively similar result was obtained with flufenamic acid (FA, bottom right), which reduced the bumps by 66% on average (n = 8). B: hyperpolarizing sags are attenuated by blockade of KCa2.x channels. Similar experimental approach as in A, except that cells with a clearly discernible hyperpolarizing sag were used and that a solution with 30 μM bicuculline methiodide (BMI) or 100 nM apamin was tested instead of low [Na+]. Bottom left summarizes the BMI results (n = 8). Application of BMI led to the appearance of an area or augmented the area between the response recorded in isradipine and the one recorded after application of BayK. Apamin had a similar effect, shown in bottom right (n = 7). ***P < 0.001, **P < 0.01, *P < 0.05, Wilcoxon signed-rank test.

