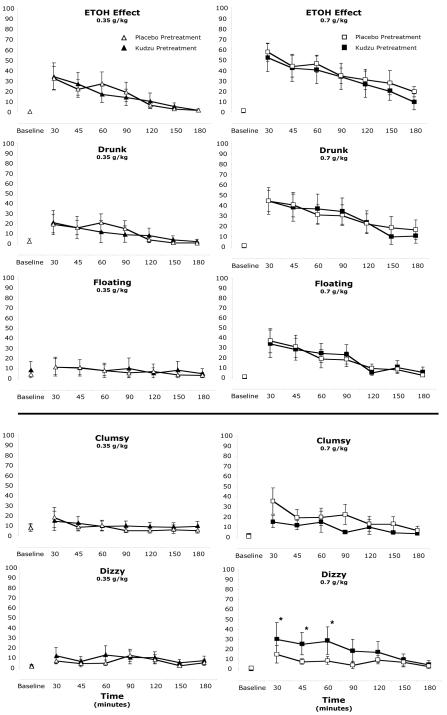
Figure 1.
Dose, time course, and pretreatment effects on 5 visual analog scales. Three ‘positive’ alcohol effect scales are shown in the top portion, and 2 ‘negative’ alcohol effect scales are shown in the bottom portion. For clarity, ratings after the placebo drink challenge are not plotted (which generally ranged between 0 and 10 for the duration of the assessment period). * Scores following the kudzu pretreatment are significantly greater than scores following placebo pretreatment, p<.05. See Table 1 for dose differences.

