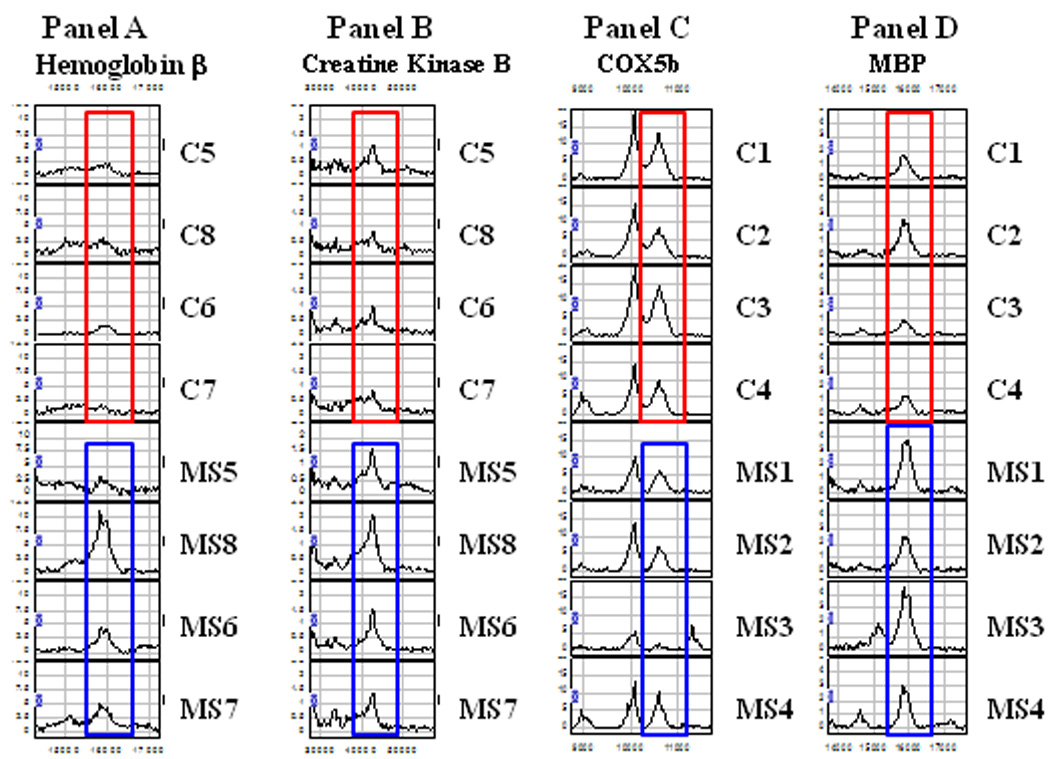
Figure 2. Proteomic differential expression of identified proteins.

SELDI-TOF mass spectra showing the differential expression of a set of peaks. Panel A: The 16 kDa peak was identified as hemoglobin β chain, Panel B: The 42kDa peak was identified as Creatine Kinase type B, Panel C: The 10.6kDa peak was identified as COX5b, Panel D: The 16kDa peak was identified as MBP. Mass spectra of mitochondrial samples outlined in red are control samples and those outlined in blue are MS samples.
