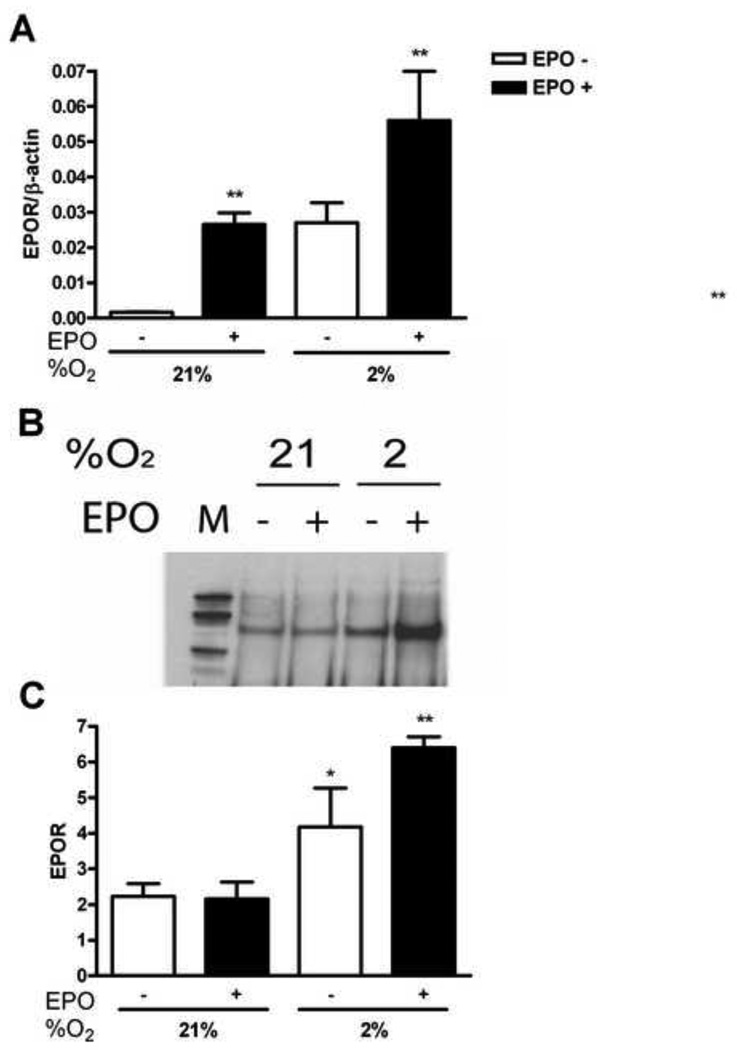
Figure 1. Induction of EPOR by hypoxia and EPO in HMVEC-L.
(A) EPOR expression was determined by quantitative real-time PCR at 21% and 2% O2, with (black bars) and without (open bars) EPO (5 U/ml) treatment. EPOR gene expresion was induced with EPO after 48 hours at 21% and 2% O2. Results were normalized to β-actin expression. Values are mean ± SEM (n=3). **P < 0.01 compared to nontreated cells. (B) EPOR protein induction by EPO in normoxia vs. hypoxia as measured by Western blotting. (C) Quantification of EPOR Western blotting showed significant induction up to three fold at 2% O2 after EPO treatment. Open bars demonstrate 21% and 2% of oxygen and black bars cells treated with EPO. Values are mean ± SEM (n=3). **P < 0.01 compared to samples under normoxia.

