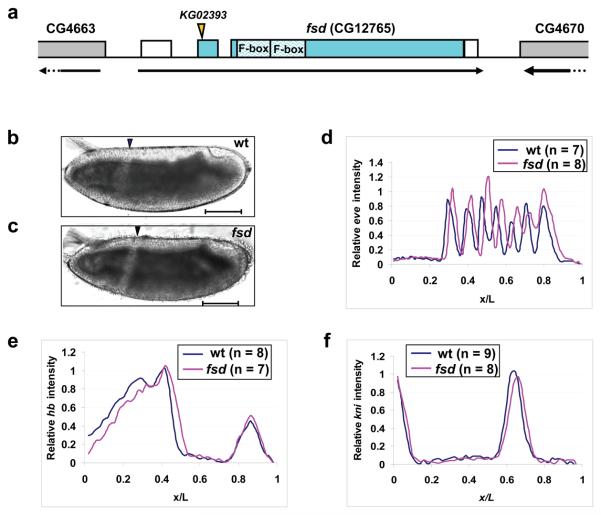
Figure 5. Posterior shift of fatemap along the A-P axis in fsd embryos.
(a) A schematic representation of the fsd gene (not to scale). The arrow under the gene shows the transcriptional direction and the boxes represent annotated exons. Filled sections of the boxes represent the annotated fsd coding sequences, while the unfilled sections represent un-translated regions. The position of the KG02393 insertion and the two F-box domains are marked. Parts of the two annotated neighboring genes are also shown in this schematic diagram.
(b and c) Shown are the midsagittal views of living embryos from w1118 (b) and fsdKG02393 (c) flies at 25 °C imaged under halocarbon oil. Arrowheads represent the CF positions. Scale bar: 100 μm.
(d-f) Shown are average normalized fluorescence intensities of whole mount FISH detecting the transcripts of eve (d), hb (e) and kni (f) in wt (blue) and fsd (red) embryos. See text for further details and Supplementary Information Fig. S6 online for data extracted from individual embryos. The expression stripes 1 to 7 have the following posterior shifts in their respective posterior boundary positions in fsd embryos: 2.2%, 1.9%, 2.9%, 2.8%, 3.4%, 1.5% and 1.1% EL.

