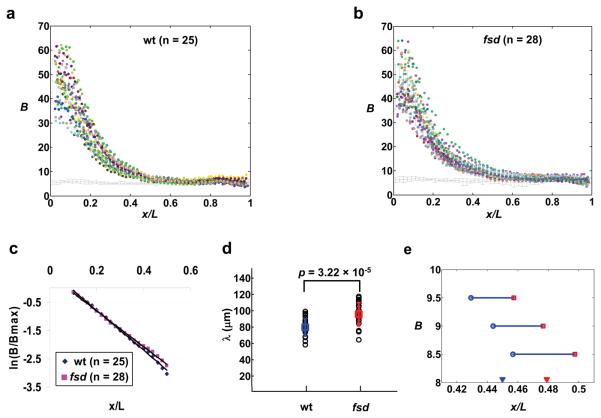
Figure 6. Bcd gradient profiles in wt and fsd embryos.
(a and b) Shown are raw Bcd intensity profiles extracted from individual wt (a) and fsd (b) embryos. The mean intensities and error bars are shown. Each color represents data from an individual embryo. The line at the bottom represents measured background intensities with errors bars shown.
(c) ln(B/Bmax) plotted against x/L for average Bcd profiles from wt (a) and fsd (b) embryos. Both B and Bmax are background-subtracted as necessary, without any further adjustments. The solid lines represent linear fits for Bcd profiles from wt (y = −7.02x + 0.61, Adjusted R2 = 0.997) and fsd (y = −6.31x + 0.45, Adjusted R2 = 0.998) embryos.
(d) Shown are λ values calculated from Bcd intensity profiles of individual wt and fsd embryos. The mean values, error bars and the p value from Student's t test are also shown.
(e) Shown are A-P positions at which the mean Bcd profiles (raw intensities without adjustments) from wt and fsd embryos cross concentration thresholds near the hb boundary. The measured average hb boundary positions in these embryos are marked with solid arrowheads for reference. Wt embryos are shown in blue and fsd embryos in red.

