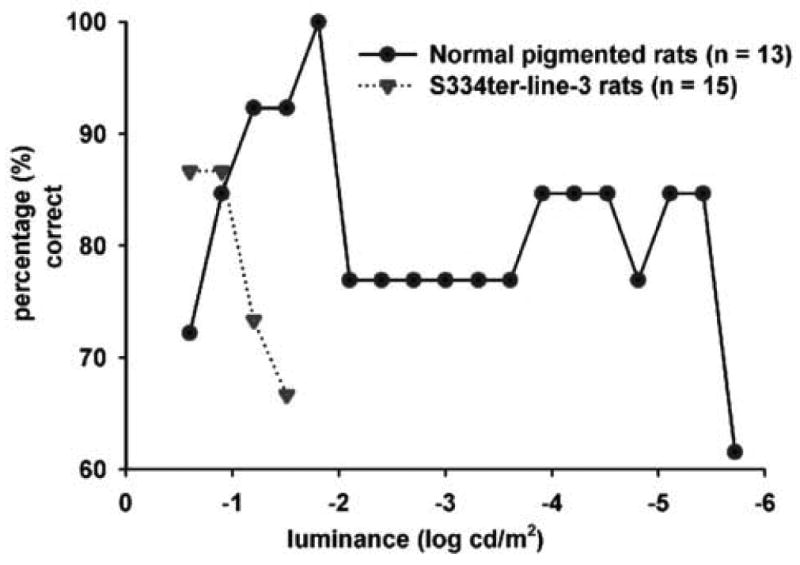
Fig. 2.

Line graph demonstrating the behavioral light sensitivity of normal pigmented rats and S334ter-line-3 retinal degenerate rats. Visual behavior of rat cohort was evaluated using the visual discrimination apparatus. Once the cohort of rats had completed one test run, the % of rats in the cohort making the correct choice was calculated. Each data point represents the percentage of success level at the corresponding stimulus intensity (log cd/m2). Initially, when a higher luminance level was used for visual stimulation, both normal pigmented rats and RD rats maintained a 70% + passing level with the line-3 RD rats demonstrating an apparently higher success rate. When the luminance level was gradually reduced (-1.51 log cd/m2), the line-3 RD rats failed to maintain the passing level. On the other hand, the normal pigmented rats continued to maintain their good visual performance until they reached the threshold luminance level of -5.42 log cd/m2.
