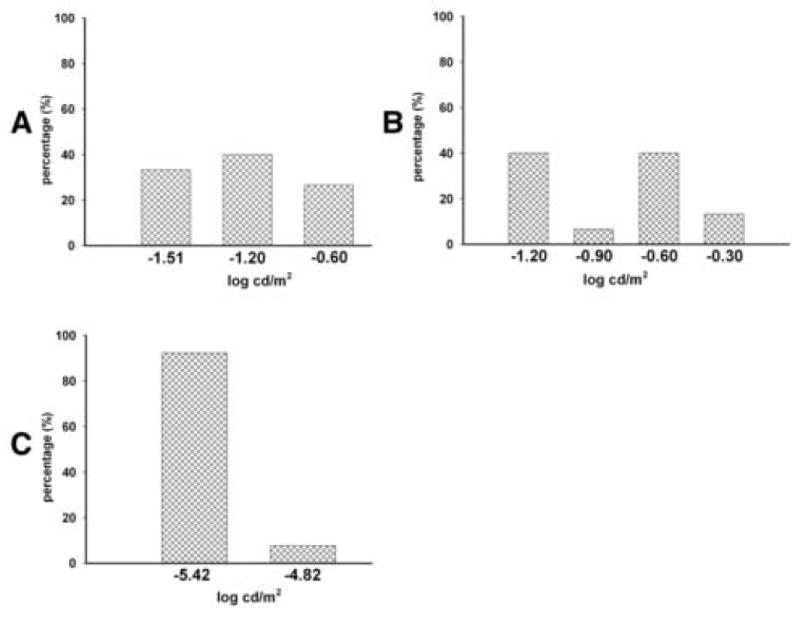
Fig. 4.

Bar diagram demonstrating higher individual variation in visual sensitivity among S334ter-line-3 rats. The visual sensitivity threshold was measured using the visual discrimination apparatus and rats were divided into various groups based on their visual performance. Each bar represents the percentage of rats belonging to a specific level of visual sensitivity. (A) At about 100 days of age, the line-3 transgenic rats were divided into three different groups based on their visual performance. (B) When tested at a later age (approximately 150 days), the line-3 rats were divided into four groups based on their light sensitivity threshold. (C) The normal pigmented rats (age 101-115 days) on the other hand showed better consistency in their visual performance with majority of them (92%) belonging to the same light sensitivity group.
