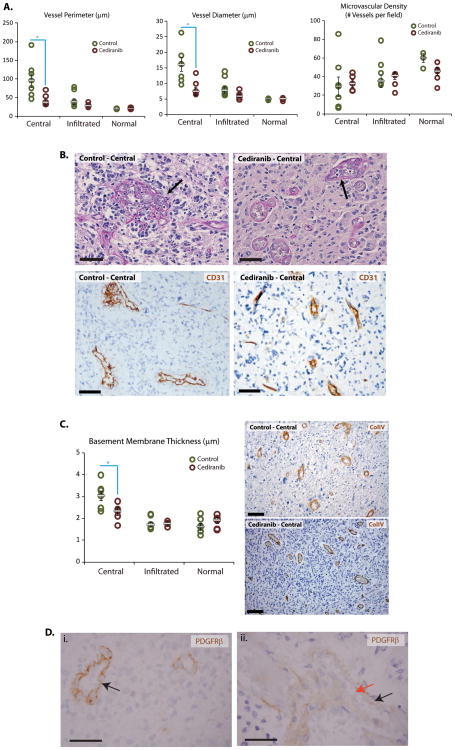
Figure 1. Vascular changes after cediranib treatment.
A: Quantification of vessel perimeters and diameters in central and infiltrative areas of tumor as well as normal brain tissue in control patients or after cediranib by CD31 immunohistochemistry shows broad variability in central areas of control cases and a narrower spectrum after cediranib treatment. Cediranib-treated tumor vessels have a significantly smaller average perimeter and diameter in the central area (p=0.02), very close to that of normal brain capillaries. Quantification of microvascular density shows that cediranib treated tumors have a similar microvascular density in the central and infiltrating areas and that these are similar to the microvascular density of uninvolved brain. Microvascular density of control cases has a broader variation in the central and infiltrated areas. B: Microvascular proliferation typical of GBM vessels was abundant in all control cases (black arrow); however it was decreased in cediranib-treated patients (arrow points at the most abnormal vessel lining). Periodic and Schiff stain and CD31 immunohistochemistry highlight abnormal vascular morphology. C: Cediranib-treated tumor vessels in the central areas have a thinner basement membrane (p=0.03), similar to normal vessels (Collagen IV immunohistochemistry). Immunohistochemistry for Collagen IV shows marked thickening of the basement membranes in the central are of the control tumors and thinner basement membranes of the vessels in the cediranib treated tumors. D: Immunohistochemistry highlights expression of PDGFRbeta by the endothelial cells in diagnostic biopsy tissue from one of the patients (i-arrow). Autopsy tissue from the same patient after cediranib therapy (ii) displayed mostly PDGFRbeta negative vessels (endothelium unstained, red arrow) while the perivascular cells are positive for PDGFRbeta as expected for normal brain vessels (black arrow). Scale bar corresponds to 50μm.

