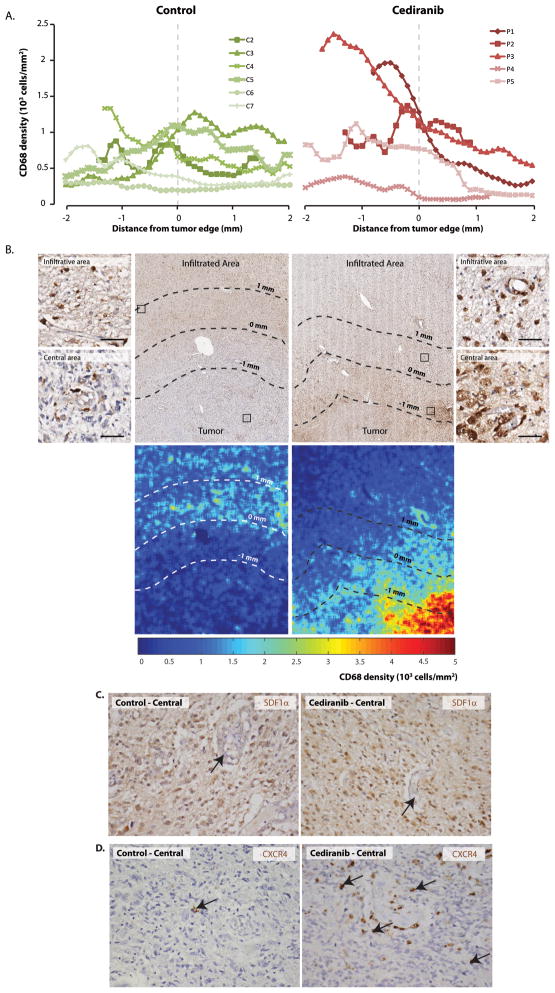
Figure 3. Tumor-infiltrating myeloid cells, SDF1α and CXCR4 in cediranib treated rGBM.
A and B: Quantification of CD68 positive cells show similar numbers of macrophages in the central and infiltrating areas of control cases. Tumors from cediranib treated patients showed a trend towards higher numbers of macrophages in the central area, while the numbers of macrophages in the infiltrating areas are similar to control cases. Immunohistochemistry for CD68 also reveals close association between macrophages and blood vessels (B, inserts). (scale bar corresponds to 50μm). C: Although we did not observe difference in expression of SDF1α (C) or CXCR4 (D) in tumor cells, control cases showed few CXCR4 tumor associated macrophages (3D left panel, arrow) while cediranib treated tumor contained many perivascular CXCR4 positive cells in the central area of the tumor (3D right panel, arrows).

