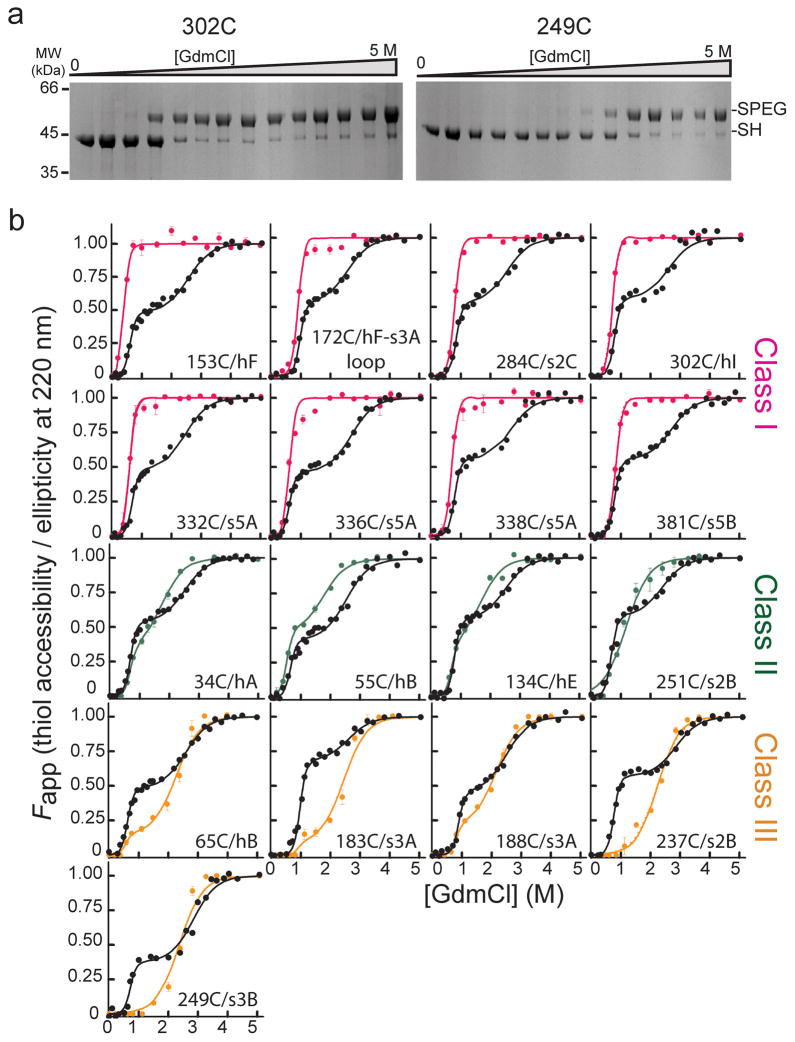
Figure 2.
Accessibility of α1AT single cysteine variants as a function of denaturant and comparison to unfolding monitored by CD. (a) Coomassie-stained SDS-PAGE results for the PEGylation of two representative single cysteine variants as a function of GdmCl concentration. Bands corresponding to the free and PEG-modified thiol are indicated by ‘-SH’ and ‘-SPEG’, respectively. (b) Comparison of the fractional accessibility of each cysteine to PEGylation (colored circles) with the unfolding of the variant α1AT monitored by CD (black circles). The solid lines through the data are the fit to a three-state or a two-state protein unfolding model as described in data analyses (see Supplementary Tables 2 and 3 for fit data). Data are grouped and colored according to the behavior of the specific cysteine site as a function of denaturant, i.e., Class I sites, which become fully accessible at low denaturant, are shown in pink, Class II sites, which become nearly 50% accessible at low denaturant and fully accessible as the protein globally unfolds, in green, and Class III sites, which are inaccessible or only slightly accessible over the first unfolding transition and then become fully accessible when the protein globally unfolds, in orange.

