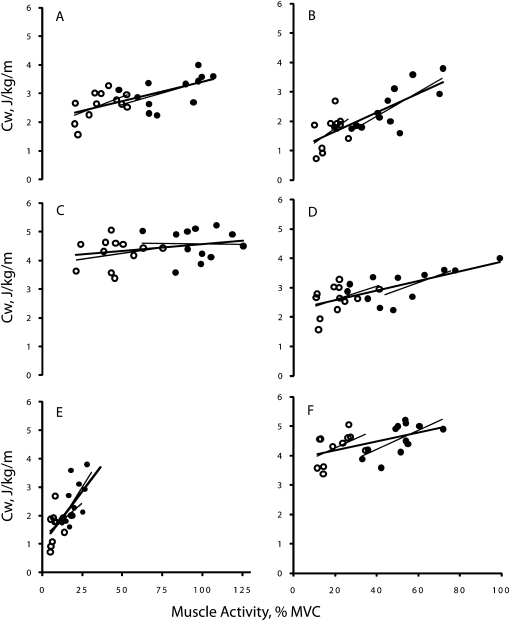
Figure 2.
Correlation between muscle activity and cost of walking (Cw). Panels (A), (C), and (E) are data for agonist muscle activity and panels (B), (D), and (F) are for antagonist muscle activity. Each type of muscle activity data is the sum of the activity measured in four leg muscles, expressed as a percent of maximal voluntary contraction. Panels (A) and (B) are during incline, (C) and (D) during level, and (E) and (F) during decline walking. Open symbols denote young and filled symbols refer to old adults. VL, vastus lateralis; BF, biceps femoris; TA, tibialis anterior; LG, lateral gastrocnemius. Thin lines denote regression within each age group and thick line denotes regression for both young and old adults. (A)—young: y = 0.006x + 4.0, r = .18; old: y = −0.0007x + 4.6, r = .02; both: y = 0.0048x + 4.1, r = .28. (B)—young: y = 0.0327x + 3.6, r = .48; old: y = 0.0325x + 2.9, r = .64; both: y = 0.0152x + 3.9, r = .51. (C)—young: y = 0.0215x + 1.8, r = .55; old: y = 0.0158x + 1.8, r = .56; both: y = 0.0132x + 2.1, r = .64. (D)—young: y = 0.0229x + 2.1, r = .42; old: y = 0.0164x + 2.2, r = .66; both: y = 0.0163x + 2.2, r = .67. (E)—young: y = 0.0472x + 1.2, r = .37; old: y = 0.0865x + 0.8, r = .62; both: y = 0.0755x + 1.0, r = .70. (F)—young: y = 0.0503x + 0.7, r = .46; old: y = 0.0405x + 0.6, r = .76; both: y = 0.0323x + 1.0, r = .76.

