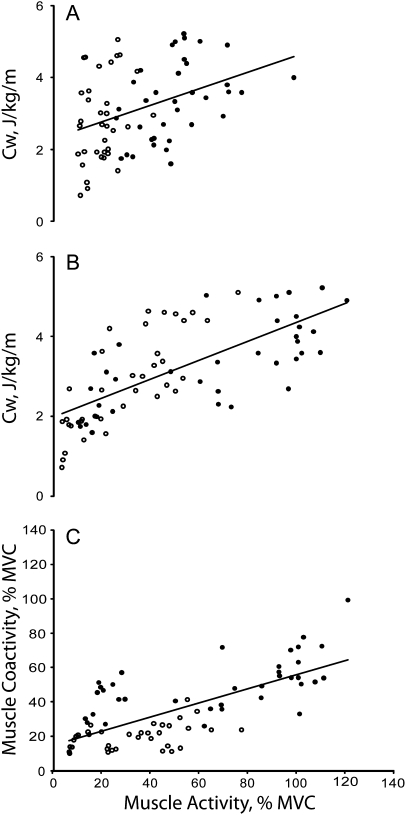
Figure 3.
Correlation between cost of walking pooled across incline, level, and decline surfaces (Cw) and agonist muscle activity (A), between Cw and antagonist muscle activity (B), and between agonist and antagonist muscle activity (C). Open symbols denote young and filled symbols refer to old adults. (A)—young: y = 0.0501x + 1.3, r = .80; old: y = 0.0212x + 2.0, r = .71; both: y = 0.0243x + 1.9, r = .70. (B)—young: y = 0.0472x + 1.9, r = .28; old = y = 0.0287x + 1.9, r = .43; both: y = 0.023x + 2.3, r = .39. (C)—young: y = 0.1703x + 14.6, r = .46; old: y = 0.2599x + 33.3, r = .59; both: y = 0.4104x + 15.3, r = .70.

