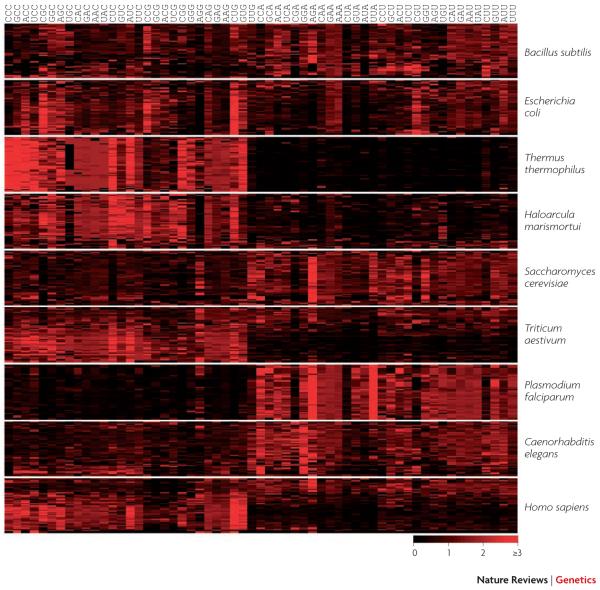
Figure 1. Codon bias within and between genomes.
The Relative Synonymous Codon Usage (RSCU) 127 is plotted for fifty randomly selected genes from each of nine species. RSCU ranges from 0 (when the codon is absent), through 1 (when there is no bias), to 6 (when a single codon is used in a six-codon family). Methionine, tryptophan and stop codons are omitted. Genes are in rows and codons are in columns, with C- and G-ending codons on the left side of each panel. Note the extensive heterogeneity of codon usage among human genes. Other measures of a gene’s codon bias include CAI35 (similarity of codon usage to a reference set of highly expressed genes); FOP28 (the frequency of “optimal” codons), and tAI128 (similarity of codon usage to the relative copy numbers of tRNA genes).

