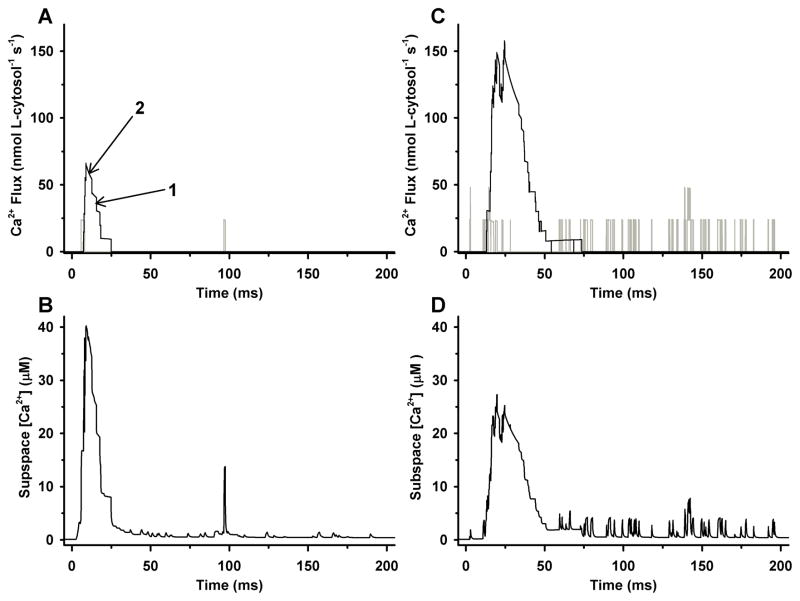
Figure 4.
Sample results for a single CaRU in response to a 200-ms voltage clamp to 0 mV34. (A) Ca2+ flux through a single LCC (gray line) and through the set of five RyRs (black line) within a single dyadic subspace compartment. Arrows 1 and 2 highlight RyR number and Ca2+ gradient driven changes in SR Ca2+ release flux, respectively. (B) Subspace [Ca2+] associated with the events of panel A. (C) Ca2+ flux through the set of four LCCs (gray line) and the set of 20 RyRs (black line) within a single CaRU. (D). Mean subspace [Ca2+] in the four subspace compartments associated with the events in the CaRU described in panel C.

