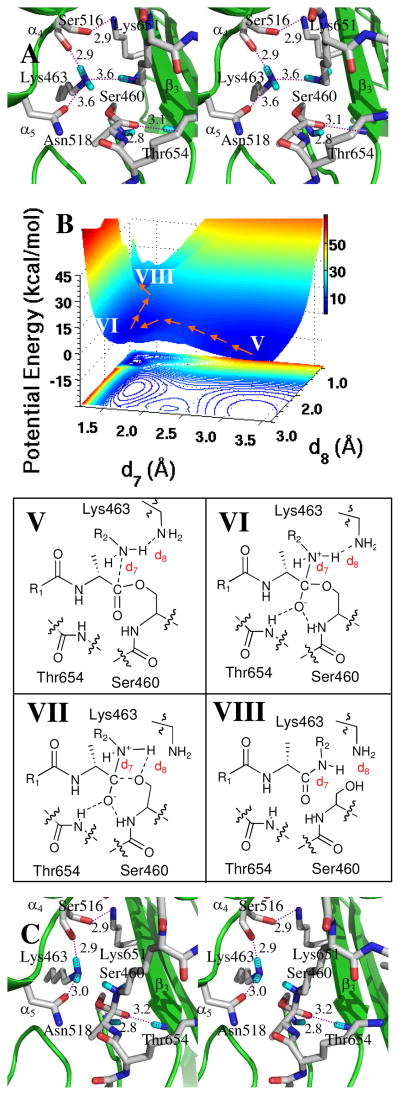
Figure 4.
Panel A shows a stereo representation of the transpeptidation reaction from the acyl-enzyme. The acyl-enzyme is nestled between β3 sheet and the loop connecting α4 and α5 helices. The acyl-enzyme and important active site residues are represented in capped-stick. Hydrogen bonds are shown as dashed lines (distances between heteroatoms in Å, rounded to the nearest tenth). Panel B shows the QM/MM potential energy surface, with the contour over the reaction coordinates represented as a shadow. The reaction path from the acyl-enzyme (V) to the zwitterionic species (VI), and from VI through transition species (VII) to product (VIII), is shown by orange arrows. The location of transition species VII on the energy surface is very close to that of VIII. Panel C shows the conformation of the zwitterionic species (VI).

