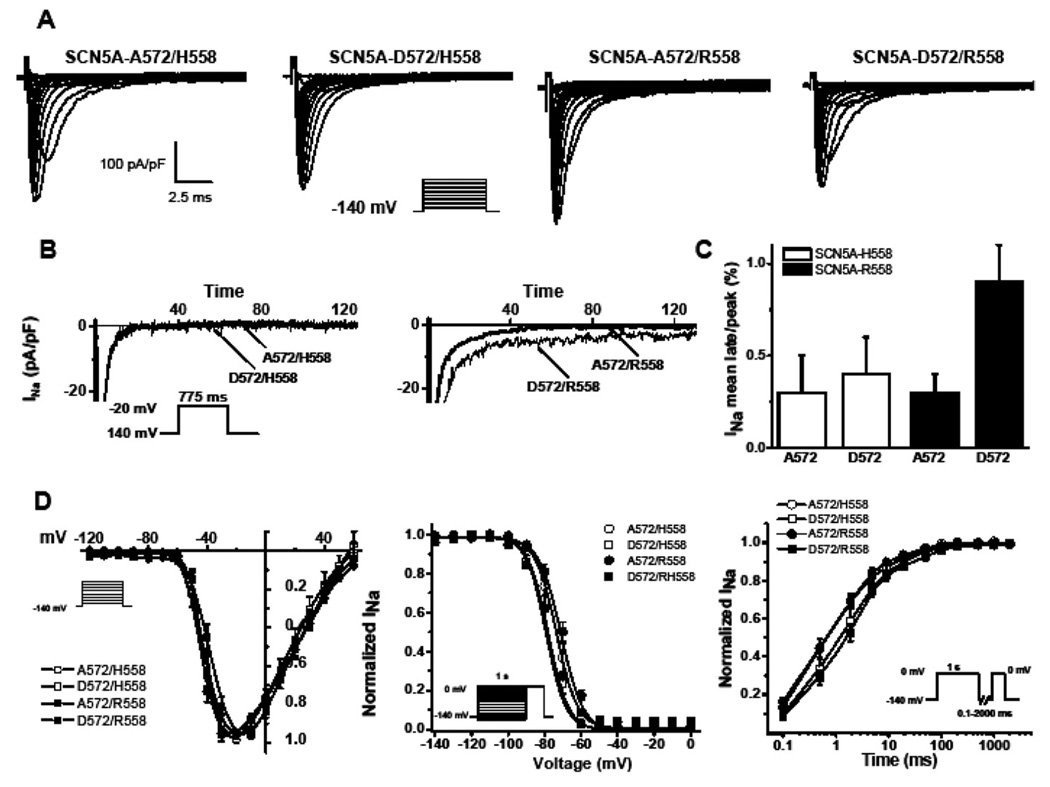
Figure 4.
A572D-SCN5A functional data in HEK293 cells. A: Whole-cell Na current (INa) from representative experiments for D572 with or without the common polymorphism R558. Activation of sodium channels was measured at different voltage steps −120 mV to +50 mV with a 10-mV step at holding potential of −140 mV. B: Late INa after leak subtraction was measured as the mean current between 600 and 700 ms elicited by depolarization from −140 mV to −20 mV. C: Summary data showing the ratio of late INa to peak INa as a percentage from several cells. D: Protocols used to address the kinetics of INa represented as inset in each plot. Data obtained from the activation protocol to establish peak INa were fitted to a Boltzmann equation to obtain the midpoint of activation. Inactivation was measured by a two-step protocol, with a holding potential of −140 mV and 1-second conditioning pulse from −150 to 0 mV with a 10-mV step and fitted to a Boltzmann equation to obtain the midpoint of inactivation. Recovery from inactivation was measured using a two-pulse protocol where a conditioning step of 1 second to 0 mV inactivated INa, followed by a test pulse to 0 mV after a different recovery period at a recovery potential of −140 mV. Data were normalized to peak and fitted to an exponential to obtain fast and slow time constants (τf and τs) and the proportion of the slow component (As) (Table 1). *P <0.5 vs A572/H558, D572/H558, A572/R558.

