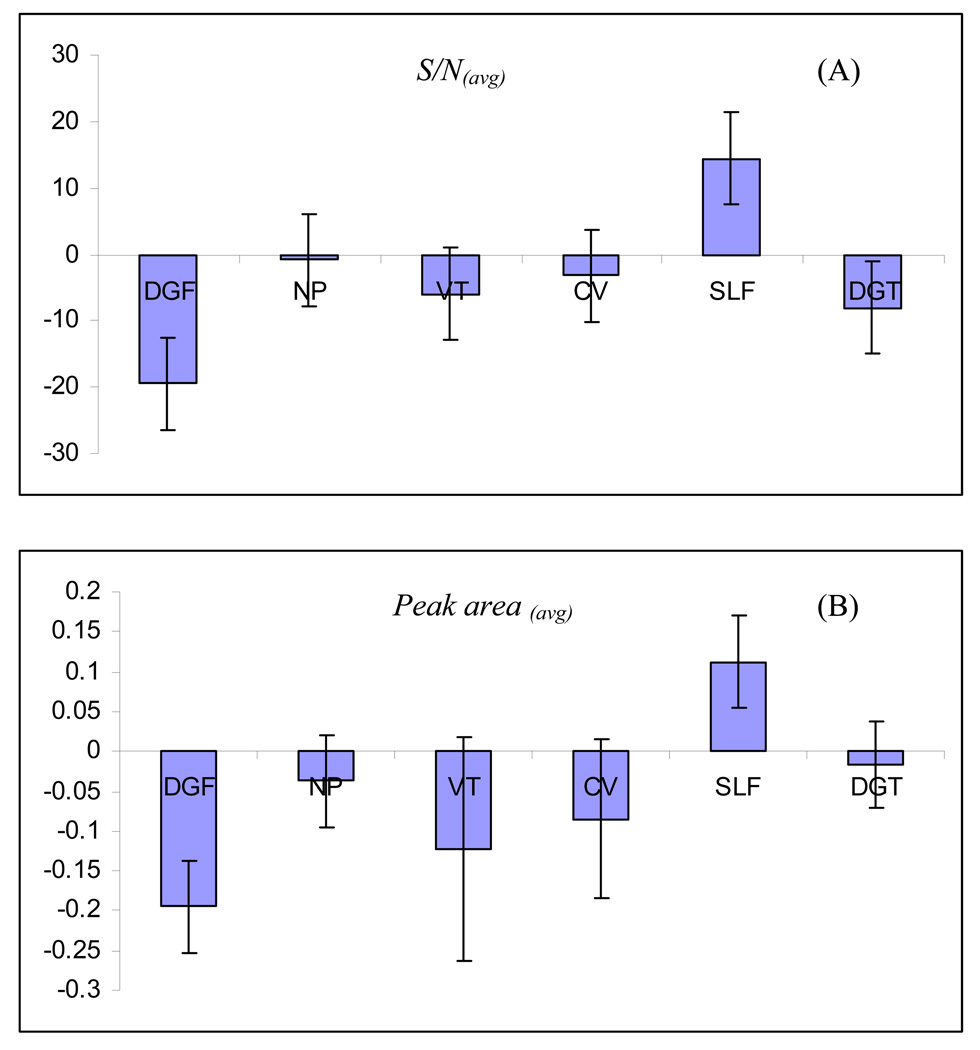
Figure 4.
The regression coefficient plots for (A) S/N(avg) and (B) Peak area(avg) obtained from FFD. Factors: drying gas flowrate (DGF); nebulizer pressure (NP); vaporation temperature (VT); capillary voltage (CV); sheath liquid flowrate (SLF) and drying gas temperature (DGT). Experimental conditions: monolithic capillary outlet position, −0.4 mm; sheath liquid composition, 50% methanol in water, 2% (v/v) acetone, 5 mM ammonium acetate. Other conditions are the same as mentioned in Fig. 3.

