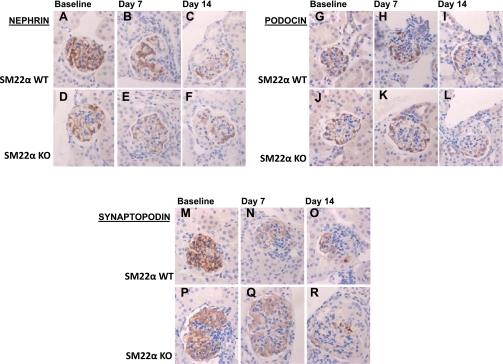
Fig. 11.
IHC for podocyte-specific proteins nephrin, podocin, and synaptopodin in SM22α +/+ and SM22α −/− mice in experimental crescentic GN. Representative micrographs of IHC for nephrin (A–F), podocin (G–L), and synaptopodin (M–R) are shown (original magnification ×40). At baseline, there is no significant difference in nephrin staining between SM22α +/+ and SM22α −/− tissues, with strong linear staining seen along the glomerular capillary loops (A and D). Following disease induction, there is diminished nephrin staining, with no significant difference between the two groups at the early (B and E) and late (C and F) time points. At baseline, there is more podocin staining in SM22α +/+ tissue compared with SM22α −/− tissue (G and J). At day 7 following disease induction, there is no significant difference in podocin staining for SM22α +/+ and SM22α −/− mice (H and K). By day 14 following injury, the SM22α +/+ tissue demonstrates greater podocin staining compared with that seen in SM22α −/− mice (I and L). At baseline, there is no significant difference in staining for synaptopodin in SM22α +/+ and SM22α −/− mice (M and P). Following disease induction, there is diminished synaptopodin staining, with no significant difference between the 2 groups at the early (N and Q) and late (O and R) time points.

