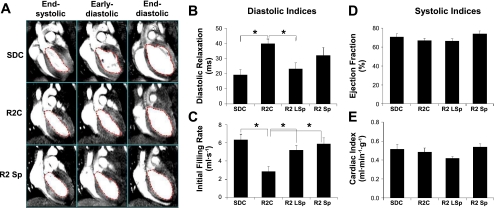
Fig. 2.
A: typical cine MRI of SDC (top), R2C (middle), and R2 Sp rats after SP treatment (bottom). A total of 16 cine MRI frames were recorded in 1 entire cardiac cycle for each rat. The frames shown here are frames 7, 10, and 16, representing end-systolic, early diastolic, and end-diastolic phases, respectively. B–E: indexes of diastolic (B and C) and systolic (D and E) function derived from the analysis of cine MRI images. *P < 0.05 vs. R2C rats.

