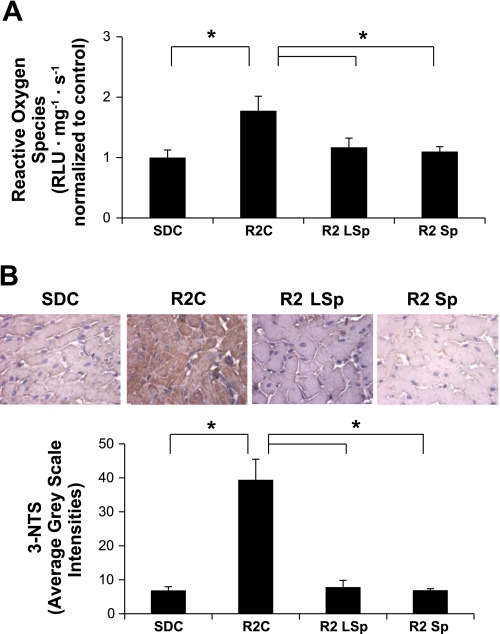
Fig. 3.
Markers of oxidative stress in cardiac tissue from control and Sp-treated SD and R2 rats. A: bar graph showing chemiluminescence-derived measures of total ROS formation. B: representative images (top) of 3-nitrotryisone (3-NTS) content, a marker for peroxynitrite formation, with average grayscale intensities (bottom). *P < 0.05 vs. R2C rats.

