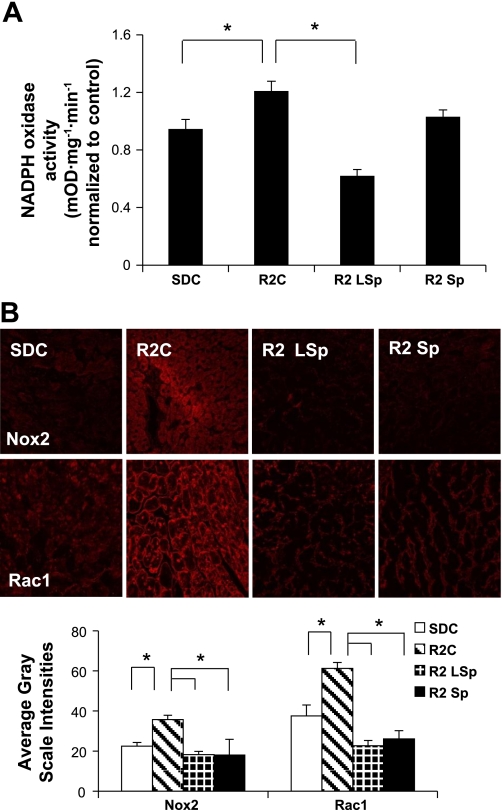
Fig. 4.
Measures of NADPH oxidase. A: bar graph showing means ± SE values of total NADPH oxidase enzyme activity in cardiac tissue. B: representative confocal images (top) of NADPH oxidase subunits [NADPH oxidase 2 (Nox2) and Rac1] with measures of average grayscale intensities (bottom). *P < 0.05 vs. R2C rats.

