Fig. 5.
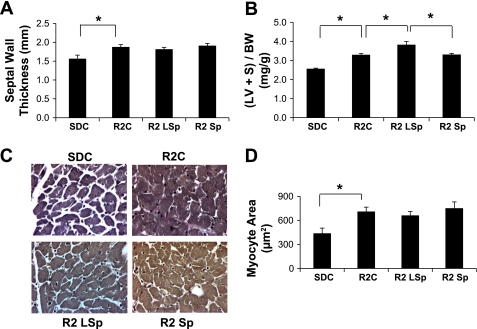
Markers of cardiac tissue hypertrophy for control and Sp-treated R2 rats. A and B: bar graphs showing increased septal wall thickness via cine MRI (A) and left ventricle + septum weight normalized to body weight [(LV + S)/BW; B] in R2C, R2 LSp, and R2 Sp rats compared with SDC rats. C: representative light micrographs of cardiomyocytes in cross section. D: bar graph showing average cardiomyoctye size expressed as cross-sectional area (in μm2). *P < 0.05 for paired comparisons.

