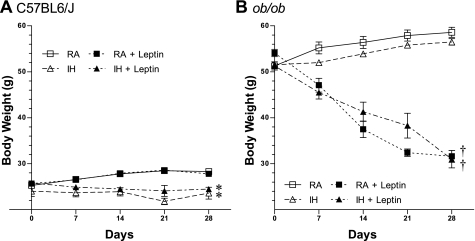
Fig. 1.
Body weight over time. Body weight recorded over the 28-day treatment period for C57BL6/J WT mice (A) and ob/ob leptin-deficient mice (B) exposed to room air (RA) (□, solid line), RA + leptin (■, dotted line), intermittent hypoxia (IH) (▵, dashed line), and IH + leptin (▴, dot-dash line). Values are means ± SE, n = 4–12/group. *P < 0.01 vs. RA; †P < 0.001 vs. no leptin.

