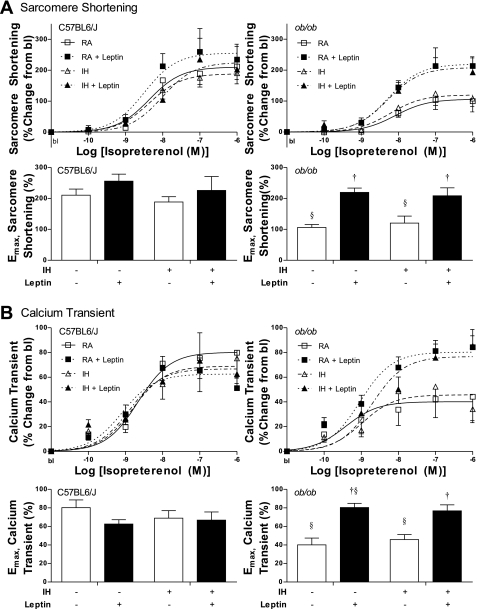
Fig. 8.
Cardiac myocyte contractile response to β-adrenergic stimulation with isoproterenol. Percent increase from baseline for peak sarcomere shortening (A) and calcium transient (B) in response to all isoproterenol concentrations are plotted for WT and for ob/ob mice exposed to RA (□, solid line), RA + leptin (■, dotted line), IH (▵, dashed line), and IH + leptin (▴, dot-dash line). Response curves were fitted with the baseline constrained to 0. The maximum relaxation responses determined from the fitted curves were compared. †P < 0.05 vs. no leptin; §P < 0.05 ob/ob vs. WT.

