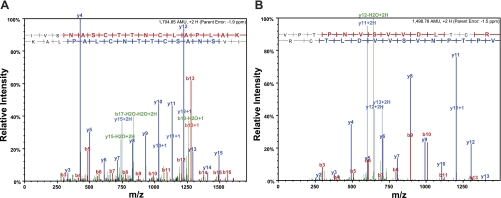
Fig. 2.
Tandem mass spectrometry (MS/MS) spectra for purified GAPDH. Representative MS/MS spectra shows fragmentation of the IVSNASCTTNCLAPLAK peptide (A) and the VPTPNVSVVDLTCR peptide (B) of GAPDH. The peptide sequence above each representative spectrum shows theoretical b ion identifications (red, NH2-terminal fragments) and theoretical y ion identifications (blue, COOH-terminal fragments). Peaks in the spectrum that are marked red correspond to matched b ions, and peaks that are marked blue correspond to matched y ions. The number paired with each ion identification (i.e., b2, y4, etc.) indicates the number of amino acids present on NH2-terminal fragments for b ions and COOH-terminal fragments for y ions. These results were obtained from the positive control experiment conducted with S-nitrosoglutathione (GSNO)-treated GAPDH. m/z, Mass-to-charge ratio.

