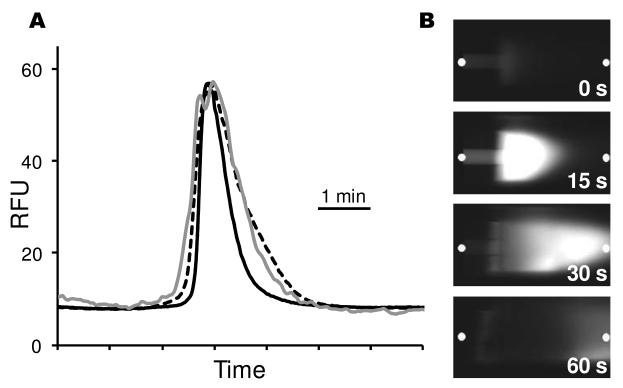
Figure 3.
Measurements of band broadening inside sheath capillary and on membrane. (A) Comparison of peak width for on-column detection (black line), in sheath 350 μm beyond the exit of the separation capillary (dashed line), and on membrane after traveling through 500 μm of sheath (gray line). The on-column and in sheath measurements were taken from the same separation. The membrane data was from a separate injection. All separations used 150 μg/mL FITC-BSA as the sample separated at 300 V/cm with an effective capillary length of 20 cm. Capillaries were not thermostatted. (B) Selected images of protein exiting the separation capillary and entering sheath capillary. Time zero represents time zone first appears at exit of separation capillary and is 32 minutes after sample injection. The white dots indicate where signal was measured to construct Figure 3A.

