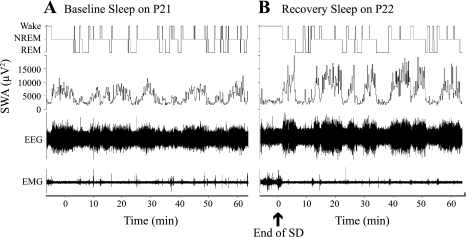
Fig. 2.
Examples of the effect of a 2-h total sleep deprivation (SD) performed on P22 on baseline sleep-wakefulness cycle architecture and NREM sleep EEG slow wave amplitude (SWA) (experiment 1). A, top: hypnogram of 60-min continuous recording of baseline sleep-wake on P21; second panel, NREM sleep EEG SWA values for P21 (μV2). B, top: hypnogram of 60-min continuous recording of recovery sleep following the SD on P22; second panel, NREM sleep EEG SWA values for P22 (ηV2).

