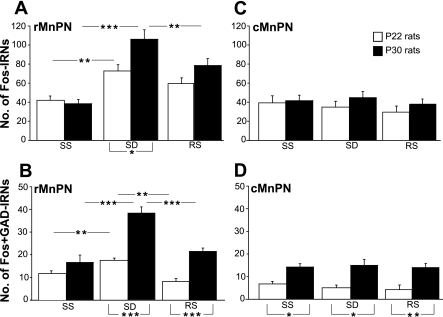
Fig. 5.
The mean numbers of total Fos immunoreactive neurons (IRNs, A and C) and Fos+GAD IRNs (B and D) in rostral and caudal parts of the MnPN (rMnPN and cMnPN, respectively) in experiment 2. Open bars, P22 rats; filled bars, P30 rats. SS, spontaneously sleeping animals; SD, sleep-deprived animals; RS, post-SD recovery sleep group. All results are reported as means ± SE. Statistical comparisons were performed by 2-way ANOVA. Significant main effects were followed by Tukey's honest significant difference (HSD) post hoc test. Analyses for simple main effects (1-way ANOVAs), required in case of the presence of significant interaction and defensible in case of the absence of significant main effects and interaction, were then applied to the data. Statistically significant differences: *P < 0.05; **P < 0.01; and ***P < 0.001.

