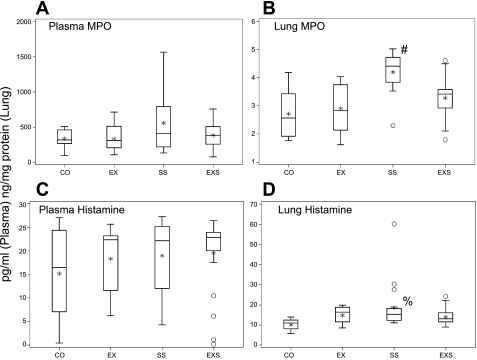
Fig. 2.
Lung and plasma myeloperoxidase (MPO) and histamine levels. Box-and-whisker plot of MPO and histamine levels in plasma and lung, among the four experimental groups: CO (n = 10, 9, 10, 9 as ordered in figure), EX (n = 15, 14, 15, 15), SS (n = 20, 18, 20, 20), and EXS (n = 21, 18, 22, 21). The box represents the first quartile, the median, and the third quartile; the whisker extends to 1.5 times interquartile range (the difference between 1st and 3rd quartiles), the asterisk is the mean, and the circles are outliers. Overall group differences were only found in the lung MPO (P < 0.0001) and lung histamine (P = 0.0076). Post hoc paired-comparison results. #SS group significantly higher than all other 3 groups, and %SS group significantly higher than control.

