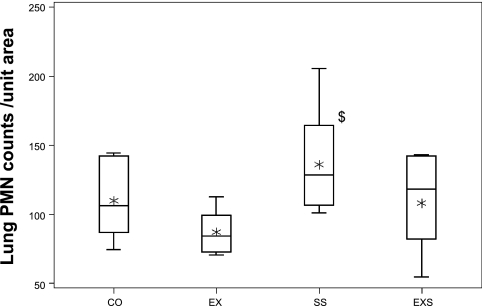
Fig. 4.
Lung polymorphonuclear leukocyte (PMN) counts. Box-and-whisker plot of PMN counts per unit area in the four experimental groups: CO (n = 6), EX (n = 7), SS (n = 8), and EXS (n = 8). The box represents the first quartile, the median, and the third quartile; the whisker extends to 1.5 times interquartile range (the difference between 1st and 3rd quartiles), and the asterisk is the mean. There is a significant overall group difference in the PMN counts per unit area (P = 0.028). Post hoc paired comparison results: $SS group significantly more counts than control.

