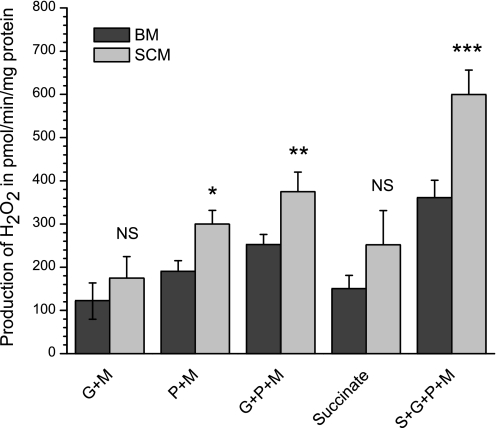
Fig. 9.
Generation of H2O2 by rat brain and spinal cord mitochondria with different substrates and substrate mixtures. Mitochondria were incubated as described in materials and methods. Total volume: 1 ml. The results are presented as means ± SE (n = 6) and show the rates of ROS production as picomoles H2O2 per minute per milligram mitochondrial protein. Additions: 5 μM Amplex red; 3 units of horse radish peroxidase; 50 units of superoxide dismutase (Sigma); 0.05 mg mitochondria; glutamate 5 mM + malate 2 mM (G + M); pyruvate 2.5 mM + malate 2 mM (P + M); glutamate 5 mM + pyruvate 2.5 mM + malate 2 mM (G + P + M); succinate 5 mM + glutamate 5 mM + pyruvate 2.5 mM + malate 2 mM (S + G + P + M). *P < 0.1; **P < 0.05; ***P < 0.001. The data for SCM were compared with the corresponding results for BM.

