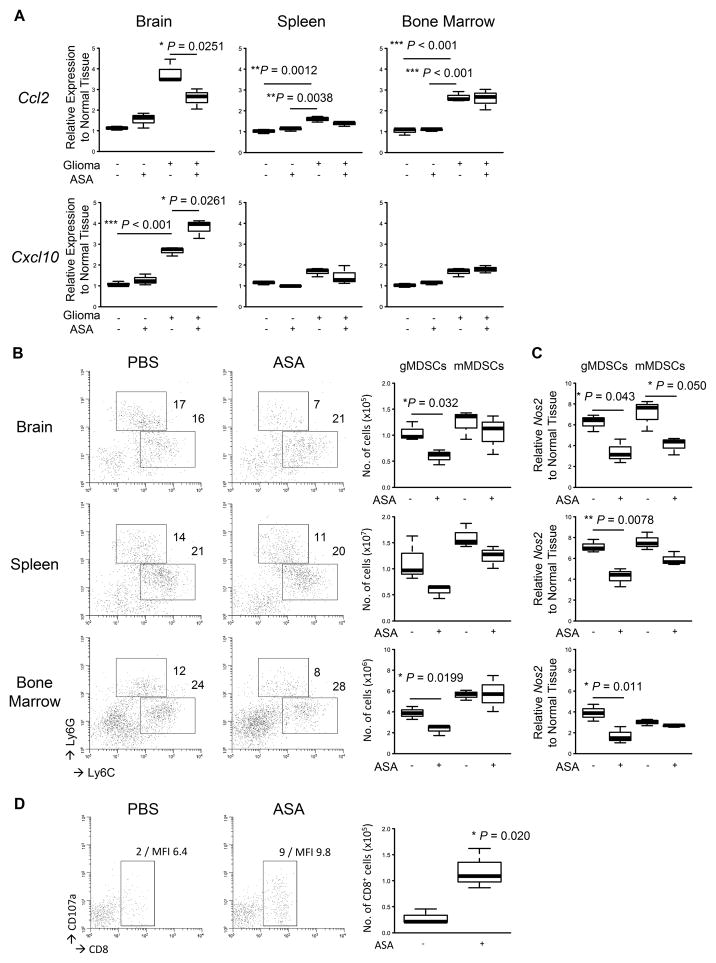
Figure 2. Effects of ASA on glioma microenvironment.
Gliomas were induced and treated with ASA or control PBS initiated on day 0 in WT mice as described in Fig. 1. The mice were sacrificed when similar tumor size was observed by BLI at days around 50 to 60. A, indicated organs were collected from each mouse (3 mice/group), and total RNA was extracted to perform quantitative RT-PCR for mRNA expression levels of Ccl2 (top) and Cxcl10 (bottom). B, leukocytes were isolated from each organ to perform flow cytometry for Ly6GhiLy6Clo granulocytic MDSCs (gMDSCs) and Ly6G−Ly6Chi monocytic MDSCs (mMDSCs). Representative flow data (left) and cumulative enumerations from multiple experiments (right) are shown. Numbers in the left panels indicate percentage of gated subpopulations in leukocyte-gated populations. C, both MDSC subpopulations were sorted, and total RNA was extracted to perform quantitative RT-PCR for mRNA expression levels of Nos2. D, the brain-infiltrating leukocytes (BILs) isolated in B were analyzed by flow cytometry for CD8+CD107a+ cells. Representative flow data (left) and cumulative enumerations for CD8+ cells from multiple experiments (right) are shown. Numbers in dot plots indicate percentage of gated subpopulations in leukocyte-gated populations and MFI of CD107a on CD8-gated subpopulation.

