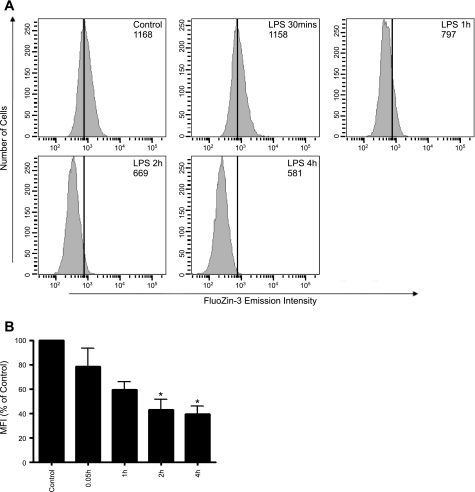
Fig. 2.
A: typical histograms of subcultures of SPAEC treated with LPS for up to 4 h. SPAECs were treated with HBSS (Ca2+/Mg2+) in the presence of LPS (100 ng/ml) for 30 min, 1 h, 2 h, and 4 h, respectively. Control cells received HBSS (Ca2+/Mg2+) in the absence of LPS for 4 h. Data demonstrate the histogram of MFI of 10,000 cells for each time point. The histograms are representative of 1 subculture of SPAEC treated with LPS. Numbers in each histogram indicate MFI. B: bar graph represents means ± SE of MFI (% of control) of samples measured in triplicate for 3 independent experiments. *P < 0.01 compared with control; 1-way ANOVA-Tukey.

