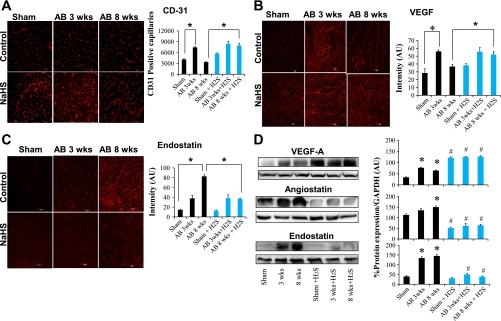
Fig. 3.
A: CD31 immunohistochemical (IHC) staining of heart (secondarily stained with Alexa Fluor 647) in sham-operated, AB 3 wk, and AB 8 wk groups (top) and corresponding H2S-treated groups (bottom). The expression of CD31 is seen as red fluorescence intensity. Data represent means ± SE from n = 6/group. *Significant difference (P < 0.05). B: vascular endothelial growth factor (VEGF) IHC staining of heart sections (secondarily stained with Alexa Fluor 594) in sham-operated, AB 3 wk, and AB 8 wk groups (top) and corresponding H2S-treated groups (bottom). The expression of VEGF is seen as red fluorescence intensity. Data represent means ± SE from n = 6/group. *Significant (P < 0.05). C: endostatin IHC staining of heart sections with endostatin (secondarily stained with Texas red fluorescent antibody) in sham-operated, AB 3 wk, and AB 8 wk groups (top) and corresponding H2S-treated groups (bottom). The expression of endostatin is seen as red fluorescence intensity. Data represent means ± SE from n = 6/group. *Significant difference (P < 0.05). Although all images used similar fixation procedures, because the immunostaining images were taken with a ×20 objective, myocyte contour may not be clear. Representative immunostaining is shown in image panels. Mean ± SE scanned intensity values from n = 6 are presented in bar graphs. D, left: Western blot analysis of VEGF, angiostatin, and endostatin expression in sham-operated, AB 3 wk, and AB 8 wk groups in control (first 3 lanes) and H2S-treated (last 3 lanes) groups. Right: densitometry analysis of protein expression [in arbitrary units (AU)]. Each bar represents mean ± SE from n = 6/ group. *P < 0.05 compared with untreated sham operated; #P < 0.05 compared with corresponding untreated controls. All images were exposed for the same duration. An equal amount of total protein was loaded onto each lane in the gel before Western blot analysis.

