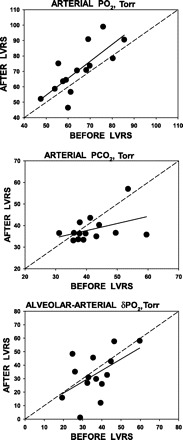
Fig. 1.

Linear regressions of arterial Po2 (PaO2; top), arterial Pco2 (PaCO2; middle), and alveolar-arterial Po2 gradient [(A-a)Po2; bottom] pre- and post-lung volume reduction surgery (LVRS). Top: almost 60% of the post-LVRS PaO2 is accounted for by the pre-LVRS value, leaving ∼40% explained by the effects of LVRS itself. Note that, in all except three patients, PaO2 improved after LVRS, and the mean increase (δ) over all patients was 6.0 Torr. The regression equation is PaO2 (post-LVRS) = −0.2 + 1.10 × PaO2 (pre-LVRS), r2 = 0.58, P = 0.04. Middle: post-LVRS PaCO2 is poorly predicted by the pre-LVRS value (r2 = 0.17). In 4 patients, PaCO2 rose, while in 2 it was unchanged, and in 8 it fell. There was no significant group change after LVRS. The regression equation is PaCO2 (post-LVRS) = 24.5 + 0.33 × PaCO2 (pre-LVRS), r2 = 0.17, P = nonsignificant (NS), δ over all patients was −3.5 Torr. Bottom: only in 30% of the post-LVRS patients is (A-a)Po2 accounted for by the pre-LVRS value, leaving ∼70% explained by the effects of LVRS itself. Note that, in 4 patients, (A-a)Po2 worsened after LVRS. The mean numerical decrease over all patients was only 3.0 Torr (NS). The regression equation is (A-a)Po2 (post-LVRS) = 2.5 + 0.84 × (A-a)Po2 (pre-LVRS), r2 = 0.28, P = NS.
