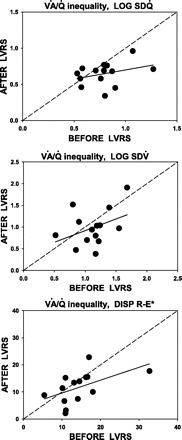
Fig. 2.

Linear regression of indexes of ventilation-perfusion (V̇a/Q̇) distribution [top: second moment of blood flow distribution (log SDQ̇); middle: second moment of ventilation distribution (log SDV̇); and bottom: dispersion of retention minus excretion of inert gases corrected for dead space (DISP R-E*)] pre- and post-LVRS. Top: almost none of the post-LVRS value of log SDQ̇ is accounted for by the pre-LVRS value. The mean decrease over all patients was significant at 0.14 units. The regression equation is log SDQ̇ (post-LVRS) = 0.45 + 0.25 × log SDQ̇ (pre-LVRS), r2 = 0.11, P = 0.03. Middle: almost none of the post-LVRS value of log SDV̇ is accounted for by the pre-LVRS value. The mean decrease over all patients was insignificant at 0.14 units. The regression equation is log SDV̇ (post-LVRS) = 0.38 + 0.54 × log SDV̇ (pre-LVRS), r2 = 0.15, P = NS. Bottom: almost none of the post-LVRS value of DISP R-E* is accounted for by the pre-LVRS value. The mean decrease over all patients was insignificant at 1.3 units. The regression equation is DISP R-E* (post-LVRS) = 4.9 + 0.47 × DISP R-E* (pre-LVRS), r2 = 0.27, P = NS.
