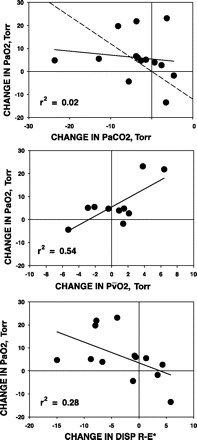
Fig. 3.

Regression of changes post-LVRS in PaO2 and changes in PaCO2 (top), changes in mixed venous Po2 (Pv̄O2; middle), and changes in DISP R-E* (bottom). Top: changes in PaCO2 (reflecting ventilation) do not explain changes in PaO2 (r2 = 0.02). Dashed line is expected relationship, if PaCO2 were the complete explanation. In 4 patients, PaO2 improved less than expected from change in PaCO2; in 7 there were small improvements in PaO2, about as expected from PaCO2; while, in 3, PaO2 improved more than expected from changes in PaCO2. Middle: changes in Pv̄O2 (reflecting changes in cardiac output and/or O2 uptake) explain ∼50% of the changes in PaO2 after LVRS (r2 = 0.54). Bottom: changes in DISP R-E* (reflecting changes in V̇a/Q̇ inequality and shunt) explain only ∼28% of the changes in PaO2 after LVRS (r2 = 0.28).
