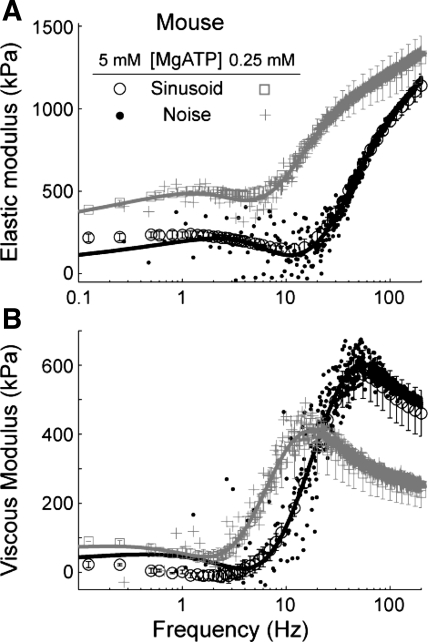
Fig. 3.
Direct comparisons of sinusoidal and white noise analyses illustrate consistent shifts among measured system behaviors as MgATP concentration ([MgATP]) varied for demembranated myocardial strips from mice. Ee (A) and Ev (B) are plotted against frequency for measurements at 27°C. Lines represent the average curve fits to Eq. 1 for the white noise analysis data at each condition. Just as each sinusoidal data point is an average among strips (with error bars representing SE), each white noise point represents the average among strips with error bars omitted (where SE at any frequency is comparable to that depicted by the sinusoidal analysis data).

