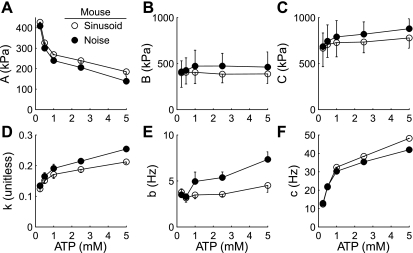
Fig. 4.
A–F: the effect of [MgATP] on estimates of model parameters (A, B, C, k, b, c, respectively) from fits of Eq. 1 to the Ee and Ev from mouse cardiac muscle (example data shown in Fig. 3). Data are plotted as means ± SE, with error bars extending downward for sinusoidal analysis and upward for white noise analysis. See text for definition of terms.

