Fig. 5.
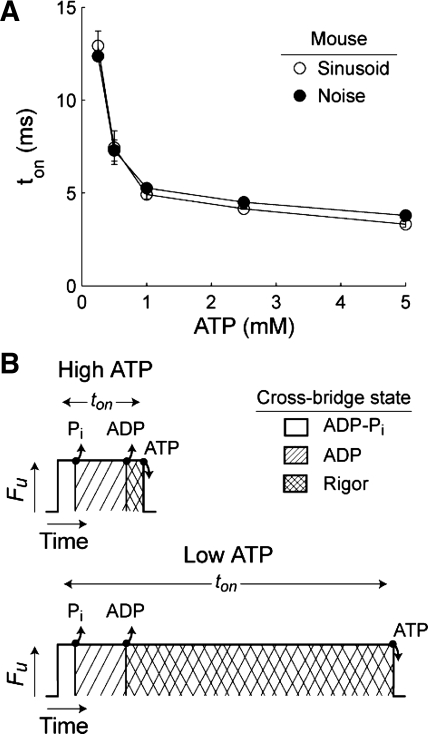
A: estimates of actin-myosin attachment time (ton) from sinusoidal and white noise analysis are shown (means ± SE) as a function of [MgATP] for the mouse myocardial measurements from Fig. 3, representing the expected increases in ton with decreasing [MgATP]. B: schematics of cross-bridge attachment events illustrating a longer rigor state as [MgATP] decreases from 5 to 0.25 mM (labeled High MgATP and Low MgATP, respectively), showing unitary force production (Fu) vs. time throughout a single cross-bridge cycle.

