Fig. 6.
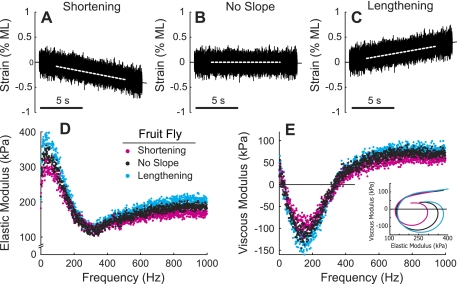
Condensed temporal requirements of white noise analysis facilitated combining normal stimuli (B) with linear shortening (A) and lengthening (C) transients to probe the effect of load on cross-bridge behavior using fruit fly dorsolongitudinal muscle fibers. Dashed lines show the mean length stimulus during the 10-s duration used to calculate the Ee (D) and Ev (E), plotted against frequency. Each point represents the average among fibers at a single frequency. E, inset: solid lines show average curve fits to Eq. 1, depicting Nyquist behavior for each condition. Temperature, 15°C.

