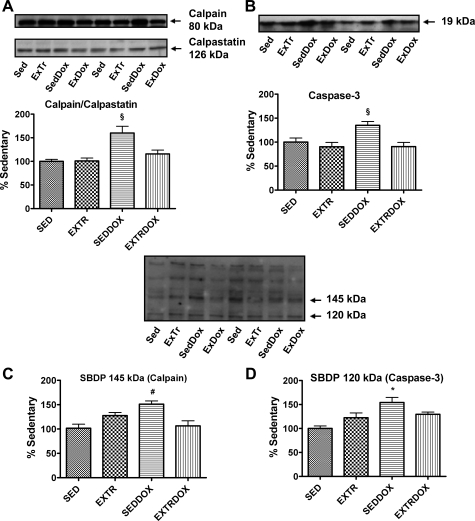
Fig. 5.
Calpain and caspase-3 activation in soleus muscle. Representative Western blots are shown above graphs. Values (means ± SE) represent percent change. A: calpain-to-calpastatin ratio as an indicator of calpain activity. §Significantly higher than Sed, ExTr, and ExTrDox. B: cleaved caspase-3. §Significantly higher than Sed, ExTr, and ExTrDox. C: α-II spectrin calpain-specific cleavage (SBDP, 145 kDa). #Significantly higher than Sed and ExTrDox. D: α-II spectrin caspase-3-specific cleavage (SBDP, 120 kDa). *Significantly higher than Sed.

